Enhanced Loss Prevention Widget on Analytics Dashboard: Gain Deeper Insights into Scan Discrepancies

We're excited to announce a significant update to the Loss Prevention widget on your Analytics Dashboard, designed to provide you with even deeper insights into scan discrepancies identified by the Supersmart validation process. This update offers a more comprehensive overview of under-scanned and over-scanned items, empowering you to make informed decisions and optimize your loss prevention strategies.

Available in version 4.3.3 and above

New Features

Here’s a breakdown of the new features included in the updated widget:

  1. Itemized Data
    • Number of items for over-scan and under-scan: Gain a granular view of the number of items involved in each type of discrepancy. 
    • The average number of items per order: Analyze the average number of discrepancies per order to understand the overall impact of scan errors on your prevented loss metrics.
  1. Order Breakdown
    • Orders with under-scan only: focuses on orders where only under-scanning was detected.
    • Orders with over-scan only: focuses on orders where only over-scanning was detected.
    • Orders with both: focuses on orders where both over-scanning and under-scanning were detected.
  •  
  1. Trend Line Graph:
    Visualize the trends of both the value of items and the number of items affected by scan discrepancies over time. This graph allows you to monitor progress, identify seasonal fluctuations, and evaluate the effectiveness of your loss prevention efforts.

Loss prevented widget overview

You can use the new widget to change views:

Adjustment source: Look into who adjusted (shopper, attendant, or combined)

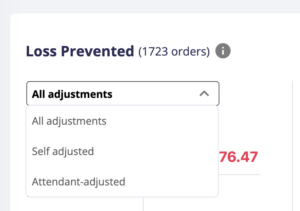
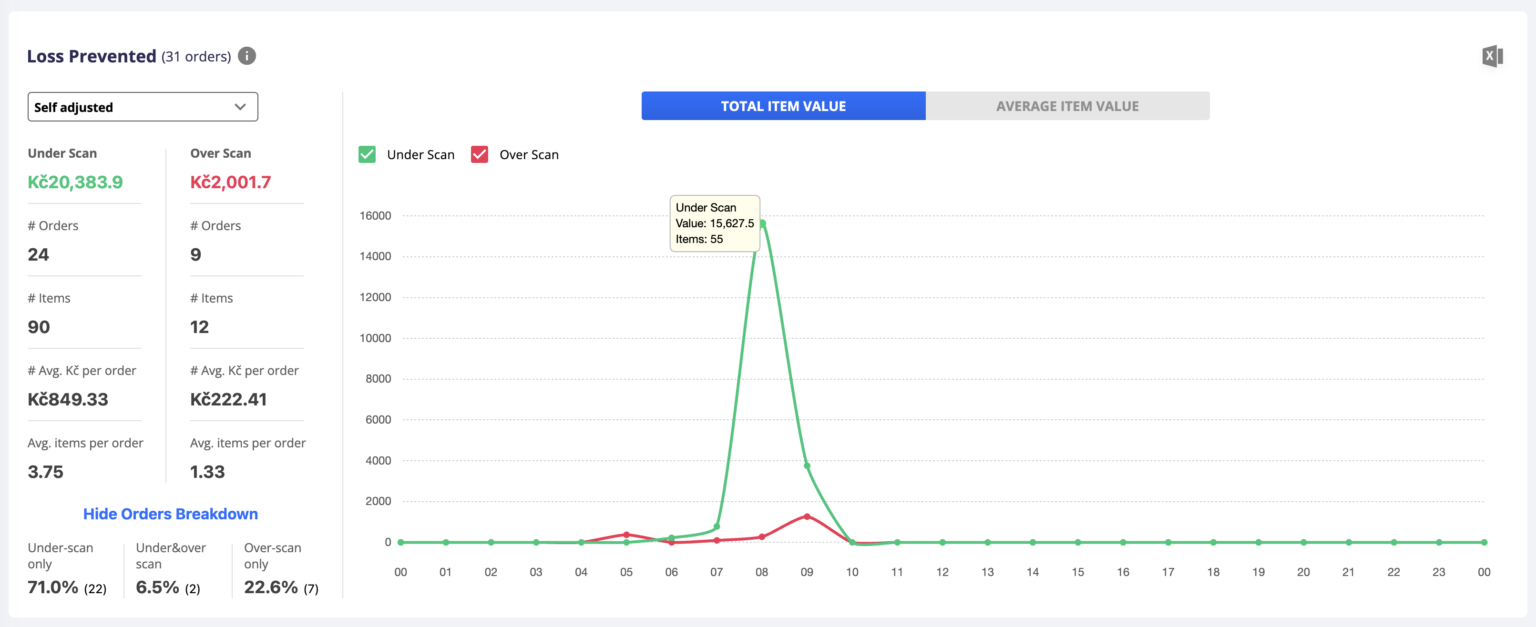
Real vs. average: Look into the trends with real or average values, by using the tabs


Benefits

The enhanced Loss Prevention widget on your Analytics Dashboard provides several key benefits:

  • Deeper insights: Identify patterns and trends in scan discrepancies to understand the root causes of loss.
  • Improved decision-making: Leverage data-driven insights to optimize your staffing, training, and product placement strategies.
  • Reduced loss: Proactively address potential loss areas based on data-driven insights.
  • Enhanced control: Monitor the effectiveness of your loss prevention efforts over time and make adjustments as needed.

This site uses cookies to offer you a better browsing experience. By browsing this website, you agree to our use of cookies.